You’re looking to launch a product, build a roadmap, change pricing, improve retention... Or you’ve just stepped into a new role as a product manager or product marketer in charge of a SaaS product.
To help you measure KPIs and discover growth and optimization insights, product analytics seems like the perfect solution to add to your tool belt, but you’re not sure where to start. This is a great place.
Here’s the catch: Product analytics is often misunderstood.
Many product teams believe that product analytics can be boiled down to gathering as much data as possible and searching for patterns of user behavior, hoping to find insights that will skyrocket their business.
But these crucial insights will not just magically appear. After months of sorting through data, many companies will give up and go back to their old ways, ignoring the value of the data they collect. You don’t want to end up at that dead-end!
The truth is: Product analytics works. Your data is a goldmine of valuable insights! What you need is a process to extract every ounce of your data’s worth. Otherwise, you'll fail to see it, even when it’s sitting right in front of you.
The good news: With a reliable framework to put product analytics in place, these insights will reveal your product’s next big opportunity for growth.
Product analytics – when properly implemented – should help you answer the following questions, at least at a high level. You can then drill down into more details and specifics:
Acquisition: What are my best-performing channels?
Activation: Where are users dropping off during the onboarding process?
Retention: How can we reduce churn?
Revenue: How are accounts upgrading to paid?
Referral: How can we have users invite more people to try the product?
Today, we’re starting over with product analytics.
We’ll use a process that I've validated with hundreds of SaaS businesses, as a CEO and Co-Founder of InnerTrends and throughout 10+ years of collaborating with companies and helping them optimize and scale with data science. It will help you properly implement product analytics and change the role data plays in your product development and your company.
Concepts like "data-driven" or "data-led" will not sound like buzzwords anymore; instead, they’ll cast meaning on your information.
Product analytics is a rigorous process in which you ensure you’re collecting the right data at the right time and in the right context. The actual analysis of the data occurs at the end of this process.
Define your key metrics – start with the customer journey
The first step of gathering product analytics data is to understand and define your customer journey metrics.
Why? It’ll bring order to the data chaos.
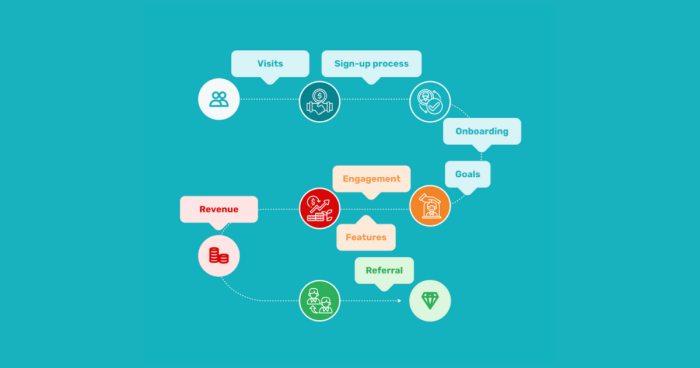
Before any data is collected, you need to map the customer journey with all of the touchpoints where users interact with your product and business.
The customer journey metrics map is crucial because it forces alignment within your company. You and your team will be on the same page about the essential concepts you should analyze, such as onboarding, activation goals, engagement, feature usage, etc.

Touchpoints alongside the customer journey. Source: InnerTrends
You are the expert on your product and target market, so you should define the touchpoints that users need to go through to get to the value of your product. The analysis that follows will help you improve the journey.
Here are concepts you should define in your customer journey metrics map, bucketed by the customer journey pillars – acquisition, activation, retention, revenue, and referral.
Acquisition
While website visits are a familiar concept to any marketer, signup intent consists of the actions on your website that show that the user is interested in signing up for your product (e.g. fill in the registration form, select package, demo request, start trial, visit pricing page, etc.).
Analyzing signup intent provides a deep understanding of how people react to your product’s promise (the headline on your homepage), your overall website content, and how much interest your promise generates with potential users.
Once you’ve defined signup intent, the following metrics will be very helpful in finding opportunities at the top of the funnel:
Qualified visits (excluding visits from existing accounts that come to log in)
Signup intent rate (rate of visitors that performed any signup intent action)
Signup conversion rate (rate of visitors that created an account)
Activation
User onboarding is a critical part of the activation pillar. It can be defined as the process that takes the user from the moment they sign up, to the moment they experience the promise of your product for the first time. This promise is the value that your product or app can deliver to him or her.
Onboarding consists of several steps, including account creation, a welcome email, the first log-in, setup (more or less complex depending on your industry), and so on.
Why is it important to define onboarding correctly?
One reason is that users that do not finish onboarding do not understand the value that the product or app is delivering to them, and therefore have no reason to continue using the product.
The retention rate of people that do not finish onboarding typically goes to zero after one or a few weeks. If you have defined the onboarding process correctly, you can validate the long-term use of your app or product.
Another more obvious reason is that you need to constantly analyze the onboarding flow, so you know what you can improve on it.
Here are a few crucial metrics for analyzing onboarding:
Onboarding conversion rate
Funnel drop off rate (onboarding step by step drop off rates)
Onboarding time (the time it takes to finish the onboarding process)
Activation goals are milestones that help you measure the impact of your features for first-time users as to how well they deliver value to your customers beyond onboarding.
What are the goals that they need to achieve to get more value out of your product? A classic example of an activation goal that everyone recognizes comes from Slack: for a team to be considered activated, they need to send 2,000 messages.
Activation metrics examples:
Number of accounts that reach an activation goal
Average goal completion time
Retention
User engagement is part of the retention pillar and is defined by the actions that users perform regularly to benefit from your product.
The easiest way to understand user engagement is by answering these two questions:
What are the main reasons why customers are using your product?
What are the actions your users need to perform on a regular basis to achieve those reasons?
Your users can be split into four categories: highly engaged, medium, low, and no engagement. The last category can also be explained as technically active, but without any lasting engagement.
It’s important to track engagement because it has a high correlation with retention. Engagement scoring is a metric that will pretty accurately predict if an account is going to churn or not.
Tracking engagement and engagement level changes, and tying these to your marketing and support activities will improve your customer satisfaction and retention.
Engagement metrics examples:
Engagement scoring
Monthly activity churn rate
The main element that encourages customer loyalty is the value delivered through your features. So list out those features one by one and evaluate performance.
Measuring feature adoption and usage through what we call “trend analysis” over time will inform you of the features' impact on retention or revenue. It will also provide insights into which features to market more, and how to get more customers to use your product.
When analyzing feature usage you will typically find features that are used a lot, and features that very few users are interacting with. If, on the second list, you find very valuable features that can make a big difference to the value your users can receive, that will give you focus for pushing those features and likely increasing the retention of your product. This is something your product analytics insights will help you validate (patience, we’ll get there).
Feature adoption metrics examples:
Features used during a selected period
Percentage of feature usage out of total active accounts

Drive Feature Adoption 🚀
Attach a release log to a widget or any native button in your app with Chameleon, and announce features in context
Revenue
From the customer journey metrics map perspective, the revenue metrics are those that simply describe how your business makes money.
If your users start with a free trial, ideally, they’ll eventually pay for your product at some point, so measuring Upgrade to Paid should be on your map.
Revenue metrics examples:
Free trial to paid conversion rate
Subscription renewal rates
Referral
How do people spread the word about your product? If you are a B2B company, and multiple users can use the same account, new users who join should be included in referral metrics as well.
Having more people from the same company interacting with your product increases the chances of word-of-mouth referrals, recommending your product to other peers in their network, or when they switch jobs.
Referral metrics examples:
Number of accounts that invited a second user to join
New accounts created from referral links
Collect data – start with a tracking plan
Now that you’ve defined your customer journey and the most important metrics you should look at, the next logical step is to make a plan as to how you should track those metrics and how you’re going to bring the data into the product analytics tool.
This plan for data collection has a name. It's called a data tracking plan.
Before diving into the definition of a tracking plan and more information on how to build it, a note of caution.
Avoid the “garbage in, garbage out” mindset
A good tracking plan will help you avoid the following scenarios:
"Why does this show X active users when we only have Y accounts in our system?"
"I think this event means ‘xxx’, but I am not sure."
“Why do we have three different properties for a plan name? Which one is correct?"
"The person who set up our analytics is not working with us anymore. I’m not sure how things are set up."
Now, back to the definition.
What is a tracking plan? And how do you build it?
A tracking plan is a communal document (typically an Excel spreadsheet or a Google sheet, but can also be part of a product analytics application) where you define the events that lead to any one of the concepts described in the customer journey section above.
You then expand on these events by listing properties associated with each event. To further define the events and properties tracked, the document should highlight why and where they are tracked.
For example: To find out how many active accounts you have, you need to track the events that lead to an account being active.
The tracking plan should have, at minimum, the following chapters:
User and account identifiers: These are unique elements that will help you identify specific users and accounts across devices and time.
Examples: User ID, Company ID, Email address, Phone number.Account properties: These are properties of users or accounts that enable segmentation. The more you collect, the easier it will be to segment data.
Examples: Created at, Account status (trial, free, paid, etc.), Paid plan details, Company size.Events: There are three types of events that you want to be tracked – core events, UX events, and third-party events.
Let’s look deeper into events.
Core events
These types of events are by far the most important and therefore need to be the most well-documented and should be tracked with 100% accuracy.
There are 10-30 core events that every business should track as part of their product analytics setup.
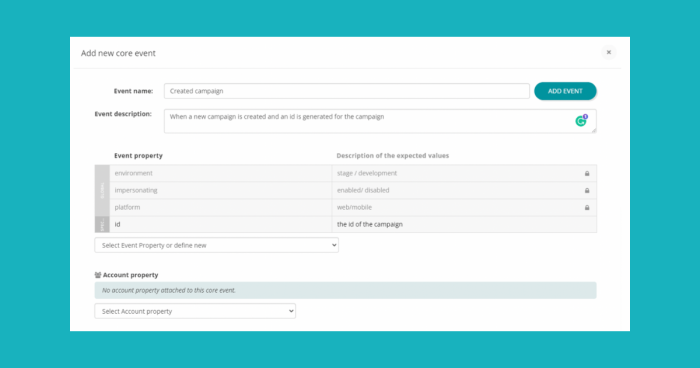
Every event should carry event properties that detail the context in which the event happened. Event properties are specific per event, so it’s beneficial to be consistent every time you name them.

An example of a core event as part of a data tracking plan. Source: InnerTrends
UX events
These are the events that describe user interactions with your product interface, such as loading screens or pages, starting to fill forms, clicking.
Most product analytics tools track UX events by default.
Third-party events
These are the events that happen in other applications that are relevant to your product, such as payment platforms, CRMs, etc., and are integrated into the product analytics platform.
A solid tracking plan will guarantee that your data tracking and necessary integrations will be implemented without having to communicate additionally with the development team. The tracking plan will cover all of the information they require in terms of what needs to be tracked and how, and they’ll make it happen for you.
Validate your data
Now that the tracking plan is well documented and the dev team has notified you that it's all done, you may be thinking: “Finally, I can jump into the data.”
Alas, no, not yet. You need to make sure your data is solid. This is actually very important. Many companies abandon their product analytics as soon as they set it up because things “don’t look right,” and they thought it was their fault for not knowing how to analyze the data.
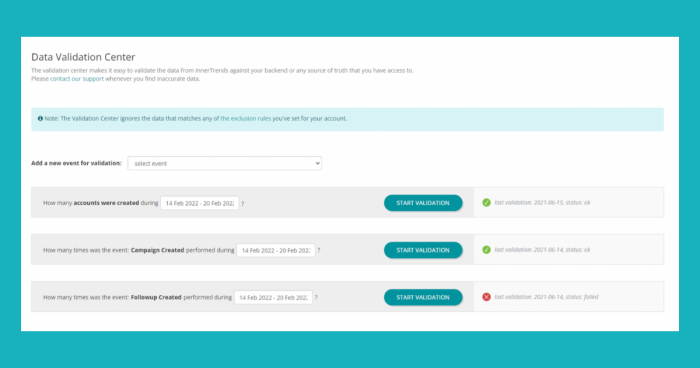
Before you jump into analysis, it's important to validate your data, making sure it’s correctly tracked. The best way to do this is to validate the core events, which should have 100% accuracy against your backend.
How many accounts does your backend tell you were created in the last seven days. Does that match 100% with your product analytics? What about the other core events?
Getting to that 100% is imperative, and we wouldn’t recommend analyzing any data until you do it.

An example of a data validation process. Source: InnerTrends
Start analyzing
You probably expected this to be the first section of this article and hoped to get here much faster. Counter to logic, sometimes to go faster you need to go slower first.
Now that you have a customer journey metrics map with the stages that your users go through, the metrics that will define the health of each stage, and 100% of all of the accurate data required to track these metrics, you can step on the acceleration.
Start from the big picture
The first thing you want to determine is what stage of your customer journey stops you from accelerating faster.
Almost every business’ data we’ve analyzed have had one problem that is bigger than all of the others. That's where you should focus all of your attention. Any resource you put towards smaller problems will be resources not put towards areas with a bigger impact on your growth. In this case, “nitpicking” is more akin to “not picking.”
It's also good to set up the right expectations as well. Here are some benchmarks that we've compiled at InnerTrends, pertaining to B2B SaaS companies:
10% of the website traffic to create a free account
40%+ of created accounts to finish the onboarding process
60%+ first week retention for onboarded accounts
20%+ of the onboarded users to upgrade to paid
Write down the questions you need to be answered
Before you dive into the data, it really helps to write down the questions you need to find answers to.
The purpose of these questions is to be able to describe a problem from as many angles as possible. You’re not looking for insights yet – you just need to have enough customer feedback that will tell us how users behave in the stage where most of them get lost.
Here are a few examples of questions that would be great to ask when trying to understand what’s happening inside the onboarding process:
How many accounts were created and how many are now onboarded?
Find out how many accounts were created in a specific period and how many of them managed to finish the onboarding process.How are accounts converting during the onboarding process?
Identify the steps of the onboarding funnel where you lose most accounts.How do emails influence accounts to finish the onboarding process?
Identify the emails that have a positive impact on accounts, influencing them to finish the onboarding process.
With these questions in mind – or any other questions you might have – you can start diving into analytics reports, formulating hypotheses, and looking for insights.
The important thing is that you now have a solid product analytics setup, and you’ve established an excellent framework for data analysis.
Wrapping up: How to make your product analytics implementation a success
Good things come to those who... do a proper analytics setup.
Getting alignment on the metrics that matter is pretty healthy for your business overall – taking a step back and asking the right questions will help you move forward in the right direction.
A solid tracking plan is an asset by itself. Your dev team will love you; your whole team will thank you.
With a reliable, validated setup, you’ve got yourself an excellent framework for data analysis. You’ll be able to trust your data and the insights you get out of it.
Lastly, having a great setup is also about finding the right product analytics software tools. Collecting high quality behavioral data is more than just having google analytics connected.
Form a good stack of data management platforms and ensure that your product managers have access to actionable insights that support your business objectives.

Weekly advice to make your product stick 💌
Be the first to get the latest product best practices and resources
This article is written by Claudiu Murariu, CEO and Co-Founder of InnerTrends, a product analytics solution. Claudiu is obsessed with data-led decisions; he's on a mission to continually raise the bar on driving insights from data to accelerate business growth and product adoption. His specialties are product analytics, growth and experimentation, and business intelligence.


