Customer retention can make or break your business. If your new customers acquired are dwarfed by churned customers, then you won't be growing. And for many, if you don't grow, it's a death sentence.
For all of the profit that new customers can provide business, research shows that 65% of business comes from previous customers, and just a 5% increase in customer retention can increase profits from 25-95%.
If these stats are hitting hard, that's good. You're in the right place to chase that increased profit margin and reduce customer churn rate. We're about to dive into customer retention metrics to learn, track, and benefit your business.
How is customer retention measured?
Ahoy, Me Hearties! Ever heard of the Pirate Metrics funnel, by Dave McClure? It’s a swashbuckling reminder of the five areas you need to cover to make your customers happy, keep them returning for more, and improve your growth strategy.
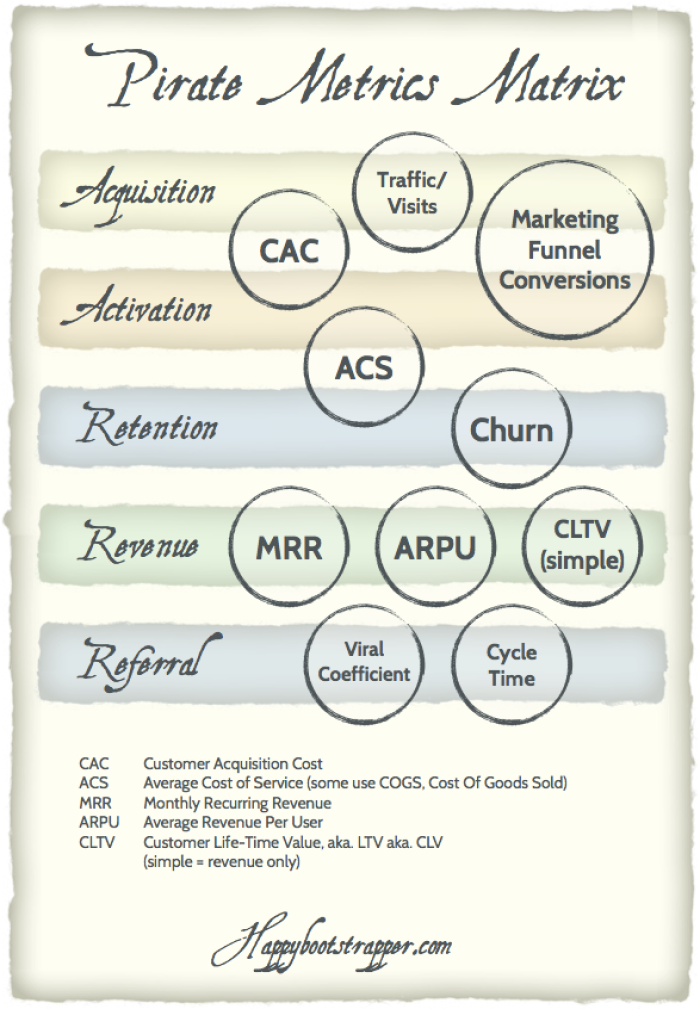
A – Acquisition. Your first touch-point with your customers, where they come from, and your brand’s first impression.
A – Activation. The tipping-point in which a customer gets your product in their hands and tries it out. Make or break.
R – Retention. What tactics are specifically for repeat customers? Also known as customer success.
R – Referral. Still the most effective form of marketing— sorry, TikTok, you’re not there yet. Word of mouth.
R – Revenue = Monetizing. At which point is someone willing to ditch the free trial or freemium plan and pay for your services or product.
Customer retention tactics play a role throughout the Pirate Metrics funnel, and they have a unique way of being measured. It’s good to get an overview of the larger picture— we were going to say boat, you’re welcome. Before you start looking specifically at retention strategies, it’s a good idea to understand your current ones and their effect.
The good news is, there are customer retention measurement equations—churn rate— that will help you directly apply an ROI on your retention strategies.
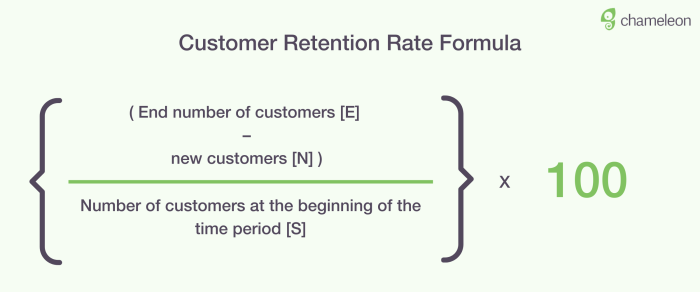
Customer retention rate formula
Select the period you want to measure
Collect the number of customers you had at the beginning of this period (S), the number of existing customers at the end of the period (E), and the number of new customers added throughout that period.
((E - N) / S) * 100 = your retention rate
Voila.
To make it easier, you can also calculate it in a Google sheet. Here's a quick demo:
Suppose you’re ever struggling to make a business case or convince a stakeholder to shift your focus to customer retention rather than customer acquisition, you can use this equation, show them the numbers, and begin to stop those customers from jumping ship 😅
Why is customer retention so important?
There’s a ton of research out there showcasing the financial benefits returning customers can bring a business. Admittedly we used the most impactful stats in our intro, yet, there are more reasons why. Let’s get into some more before benefits for increasing customer loyalty metrics.
Retention aids referrals
Throwing things back to basics with Cialdini’s six principles of persuasion. Long-term customers hit social proof and commitment. Which, in turn, result in referrals. Plus, because of people’s ingrained wiring, wanting to be seen as committed to something, their public referrals are more likely to result in them using your product for longer.
It reduces acquisition costs
With 50% of current customers more likely to try new products and paid acquisition strategies, channels like social media and Google Ads growing more expensive by the day, things need to change.
If you’re struggling to hit revenue goals, it’s time to shift focus to the customers you currently have on your books, rather than searching for new ones.
Happy customers are profitable buyers
Customers spend 31% more with a brand if they’ve bought with them before. By focusing on customer retention, you’re not only keeping customers, but you’re selling more.
It boosts employee morale
Last on our hitlist, but one that’s certainly not overlooked is what customer retention does for employee morale. Customer retention is a good sign; it affirms that people have faith in your business and mission. This validates employees’ work, and their decision to work with your business. In turn, this will boost your employee retention.
What's a good customer retention rate?
Customer retention rates vary drastically by industry, and there are two ways to measure them:
Measure retention rates against competitors or similar businesses in the industry
Measure retention rates against your own
Mixpanel found that across 30 days, the finance industry had a 5% retention rate, media 4%, and eCommerce only 1%. However, the all-round leader in retention platforms is mobile, sitting 4% above desktop in second place.
The leading industries in customer retention are:
Retail: 63%
Banking: 75%
Telecom: 78%
IT services: 81%
Insurance: 83%
Professional services: 84%
Media: 84%
If you’re in the Saas industry, customer retention over 35% is above the industry average. Remember, all of these retention rates are comparing your business to others. They’re a good starting point for benchmarking, but if you have the data for your past retention tactics, then it’s a good idea to look at that and set KPIs for improvement.
4 key customer retention metrics to learn
There are many customer retention metrics out there, and many of them depend on your industry niche. We’re about to dive into four customer retention metrics that could change the game for your SaaS customer retention strategies.
1. Customer retention per cohort
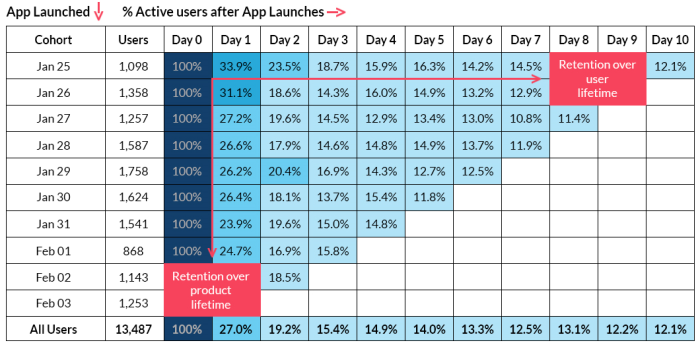
A cohort analysis is an incredibly useful way to get a good overview of a churn trend at a particular time after onboarding. Separate users into cohorts, by start day—or even start week if you don’t have too many—and lay each cohort’s retention rate alongside the other per day/week/month. You’ll be able to see a few things:
A trend in plateaus
What does it show? This is the duration of time that all of your cohorts stop showing signs of churn and start showing signs of retention. It suggests the “aha” moment for users.
What can you do with this data? It’s a good idea to understand what messaging or experience the user receives on this particular date, or what they’ve received so far. It can be an accumulation of great content or one specific piece of content that has convinced them your product is the best fit.
A definite churn
What does it show? It means all of your cohorts are churning until there are practically zero users left per cohort.
What can you do with this data? Churn rate is not a pretty statistic to come to terms with, but a cohort analysis can help identify this and assure you that no matter your campaign, or time of year, something is wrong with your product and needs changing.
A trend in drastic churn
What does it show? This will help you identify if you have a particular moment in the product life cycle, during which many customers are dropping off.
What can you do with this data? Dive into that particular moment and look at messaging or user activity. What’s happening at that moment in time to make users quit? Change it.
How to improve customer retention with a cohort analysis
For all of the areas a cohort analysis will help you identify, there’s one key thing it will enable you to do: to minimize the time it takes to get a customer to their “aha” moment. By identifying that steady plateau, or that sharp churn, you’ll understand what works, what doesn’t, and ultimately move what’s working closer to day zero.
2. Lifetime customer value (LCV)
Your lifetime customer value enables you to understand how much money your business can potentially make from a customer throughout a given period. It will help you to put a value on and win budget approval for lifecycle marketing. There’s a relatively simple equation you can use to understand this.
SSA x RTA X RP = Average $ LCV
Single sales average x repeat transactions average x retention period (years) = Lifetime customer value
For example:
$50 average x 12 transactions x 6 years = $3,600
What can you do with this data?
By collecting and analyzing this metric, you’re able to assign the ROI on acquisition and retention strategies. Once you’ve set this ROI, you can then explore ways to expand this ROI and build a larger profit margin by considering a few of the following things.
Increase pricing
Increase retention period
Psst. Go for box number two. Increasing your retention period over increased pricing makes for happier customers with you for longer. It can generate more sales for your business via recurring revenue and minimize spend or acquisition efforts—a more positive way to reduce customer churn. It’s a win for your business, and greater retention means you’re a win for your customer.
How can you improve customer lifetime value?
There are many ways you can improve on this metric, especially when focusing on the retention period. Consider initiating a customer loyalty program via your customer success teams, give free samples of new products or features to long-standing customers, and build strong customer relationships with your workforce and their customers.
Try to personalize a customer’s lifetime experience with your business, not just their acquisition process. There’s nothing worse than getting so much attention in the sales process and then being forgotten about once you’ve bought.
3. Net Promoter Score (NPS)
NPS is the most widely used method to collect customer feedback. It supports product-led growth with qualitative data. Something worth noting is the level of detail you’re willing to go into to get qualitative results, and how much time your customers are willing to give when answering your questions.
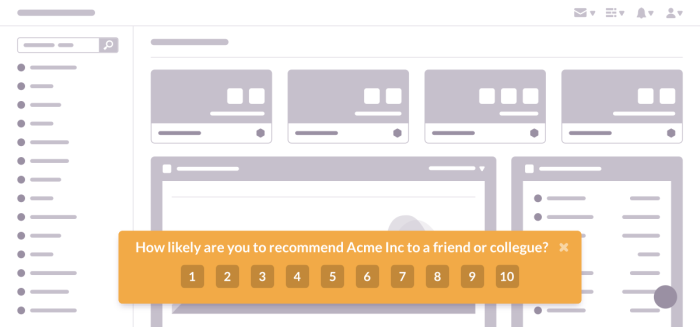
There’s a lot to be said from someone’s response to “How likely are you to recommend our product?” as well as whether they’re even willing to answer it or not, as well as any more questions you may have.
What can you do with this data?
Net Promoter Score insights can give you a fantastic idea of how your customers view your business, how loyal customers are to your business, and if there's potential to introduce or focus more on referral marketing strategies.
They can also highlight the need to focus on your customer retention more if you’re averaging at a low NPS. These same low net promoter scores can highlight root causes for customer churn and suggest future product features to thread into your product roadmap.
How can you improve your NPS?
The most direct way of changing a low NPS is by addressing it. If you ask the right questions, you should be able to identify core areas of your business that need improvement. Show your customers that you’ve listened to their needs and problems with your business and product.
Next, follow up on what you’ve learned and make actionable points to change your business for the better. Your customers will be grateful for the change and will feel more emotionally obliged to see you succeed, knowing they’ve played a larger part in your growth journey.
4. Customer engagement rate
Engagement is an essential metric to understand and a proactive way of retaining customers. Rather than looking at churn and specific drop-off dates, it looks at those moments before, when a user becomes disengaged.
Unsubscribing is a lift, and perhaps someone just hasn’t got around to doing it yet; this metric informs you that in their head, they’re already without your product.
To track this, you need to look at all of the potential engagement channels you have going. Of course, we need to look at product activity, but there are most likely other places you’ll be engaging with your customers that you need to consider.
Product
App or Website
Email
Messaging / Chat
Webinars
Social Media
Each of these areas will require a specific set of tools to track engagement. Plus, some you will need to place more importance on over others, depending on your product and the level of engagement it requires.
What can you do with this data?
Once you’ve collected this data, you can do a few things with it. You can identify an average or standard brand engagement rate for customers that stick. You can then use this metric as a KPI when looking to up your user engagement rates.
Secondly, you can spot trends in decreasing engagement rates before a user unsubscribes from your product. In doing so, you’ll be able to implement a re-engagement strategy when someone falls below a certain level of engagement.
Thirdly, you can identify wholly disengaged customers—those already out in their minds but just haven’t got around to unsubscribing. It’s your opportunity to do three things, either reel them back in, offer them a plan B, or ask them if they’d like to leave.
What, what? Why would you ask a user to leave your product?
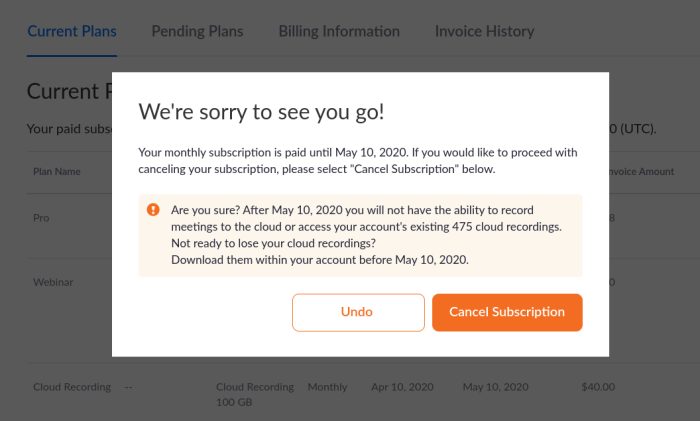
Well, If someone is not using your product, then you need to find out why. Microsurveys can help you identify this; perhaps your product is just not for them. If that’s the case, then figure out why they thought it was, offer them a decreased plan with another educational tour, or to unsubscribe.
The brand affinity, loyalty, and trust you’ll win by putting the customer first is well worth the financial loss.
Other customer retention metrics to keep in mind
We could dive into this topic for hours more—but that's not what blogs are for (email us if you want to talk more about it though, it's one of our favorites!). If you're interested in further reading, we put together a guide on: “How to Reduce Customer Churn: SaaS crisis survival guide.”
However, if you want to stick with us for a little while longer here, let’s dive into a two more metrics to keep in mind for customer retention.
Downgrade Churn & Upgrade Growth
An excellent metric for understanding the number of customers that downgrade or upgrade to new plans, and the ROI from their actions. Use Microsurveys to identify product friction, and adjust your product and plans accordingly.
Days sales outstanding
Track any period between billing and receiving payment, as well as if a customer has opted for a one-off upfront payment or monthly recurring debit.
All of these factors are signs of a customer’s trust in your product and your business. A lengthy DSO suggests either a dissatisfied customer or a customer who doesn’t care too much for your working relationship—both ominous signs for their retention period.
How can you boost your retention metrics?
Let's take a look at a few SaaS brands that retained customers with smart tactics.
Top-notch onboarding with Sprout Social
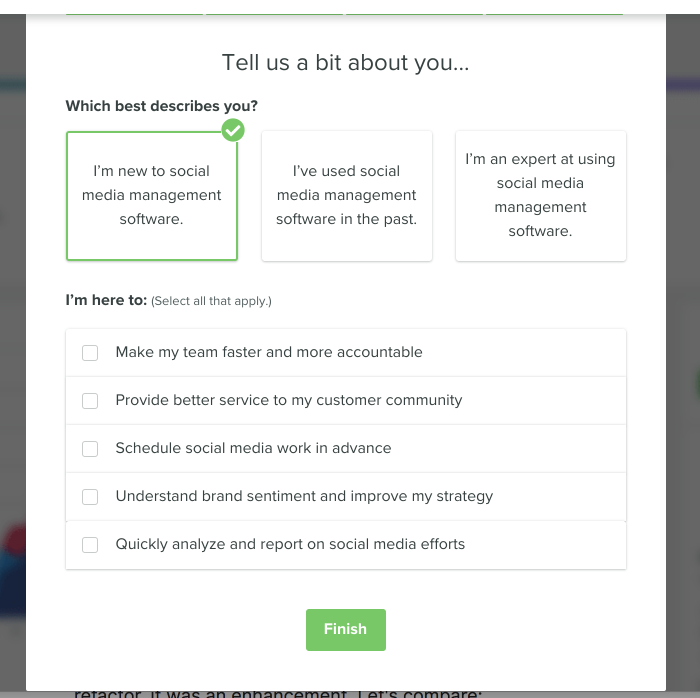
Sprout Social, the social media management platform, are notorious for their customer onboarding and solid customer base. They make sure they align customer knowledge with expectations as well as providing a stellar education onboarding tour.
Their resources center also allows them to continue to educate customers throughout their time with Sprout, ensuring they get the most from the platform and continue to use it.

How Voxox improved customer retention with Chameleon
"Concentrating on user experience and iterating quickly led to more than a 50% reduction in churn and a 20% increase in user activation! This was tremendous return on solving the activation problem."
Instant customer service with N26
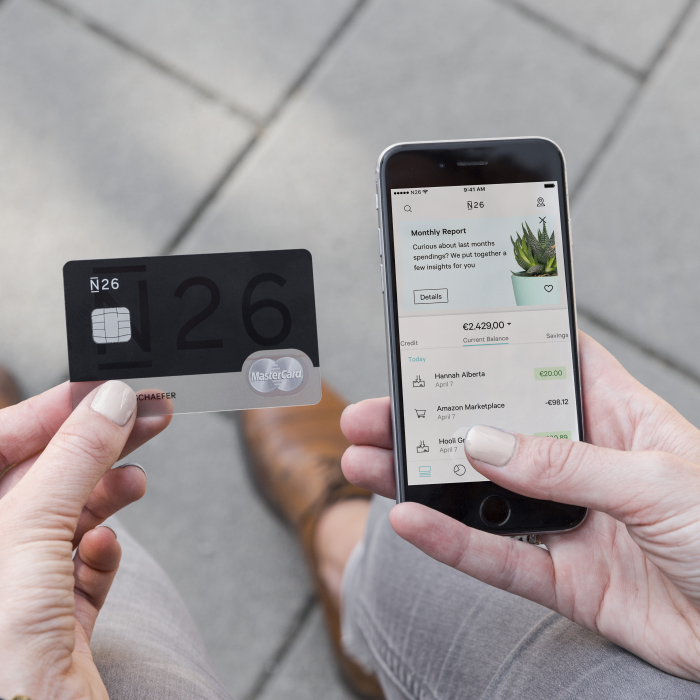
N26, banking by design is a bold statement to put alongside a brand’s name yet a mission that N26 is chasing—right down to their customer service. N26 gives its customers the ability to chat instantly with a rep, interact seamlessly with a chatbot, seek self-service support, and offer omnichannel support so a customer can pick a communication channel that suits them best.
Putting customers first with Amazon for Business

Surprise, Amazon made the list! For everything they’re doing well in their B2C efforts, they’re doing exceptionally well with B2B. Their Amazon for business product truly champions small businesses, their journey to success, and their customer satisfaction.
Plus, if they notice you’re not using your membership as you should, they’ll call you up, notify you, offer to cancel your membership, and reimburse you for the time it’s gone unused.
Wrapping it all up
Customer retention strategies are tricky waters to navigate. Pirates aside, there are many routes you can take to retain customers, but first, you need to win buy-in to focus on them in the first place. Before you go about building a customer retention strategy, get some key data points highlighting what it can do for your ROI.
One key takeaway to learn from this article is that customer retention is about customer expectations. If you’re managing what customers can expect from your brand and product, then you’re managing how they interact with you, for how long, and what they can expect from you in the future.
Manage customer expectations with a stellar onboarding process. Introduce people to your product smoothly and efficiently, helping them get the most out of their purchase and ensuring they know what they can expect from you. Do this well, and you’re not just managing customers, but you’re creating brand ambassadors that stick around for the long-haul.


